
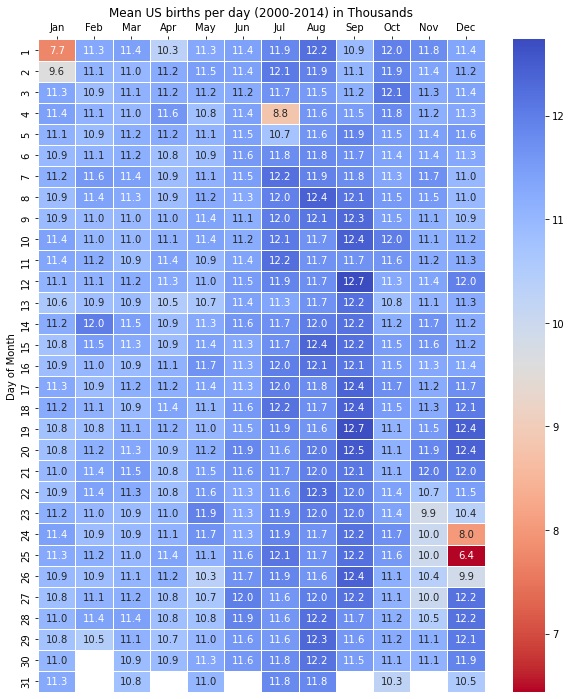
The color scale is terrible. Here is a more credible chart based on presumably the same data by Social Security Administration, covering 62,187,024 US births (2000-2014).
Meanwhile, the post’s chart’s actual Reddit OOP is u/plotset, an account made to shill PlotSet.com, a data visualization software.
They had this to say about the data:
This data represents 4,153,303 US-born babies only between 2000 and 2014.
Top 10 Most Common: Sep 12 (0.307%) Sep 19 (0.306%), Sep 20 (0.302%), Dec 19 (0.300%), Sep 10 (0.300%), Dec 20 (0.299%),Sep 18 (0.299%), Aug 8 (0.299%), Sep 26 (0.299%), Sep 17 (0.298%)
Top 10 Least Common: Dec 25 (0.155%), Jan 1 (0.186%), Dec 24 (0.193%), Jul 4 (0.212%), Jan 2 (0.231%), Dec 26 (0.238%), Nov 23 (0.238%), Nov 25 (0.240%), Nov 27 (0.241%), Nov 24 (0.241%)
Data Source: Kaggle.com/datasets/ayessa/birthday
Tools: PlotSet.com
Note that the “4,153,303” figure is bullshit. It is close to births per year but does not actually correspond to the sum in any of the 15 years, nor the average.
Also, neither chart normalizes by weekday: 3 of the years in question started on Tuesday and Saturday while only 1 on Friday, causing most of the variation that got amplified by OOP’s terrible color range. (Because of leap years, I made a table of most common starting weekdays for each month; see my other comment. For example, one of the most common birthdays, August 15, was more often Wednesday or Friday than Saturday.) Without doing weird math, one can ensure the effect of weekdays is largely mitigated by using data from 28 consecutive years, which I believe can be pieced together from several good online sources but I’ll be leaving that as an exercise to the reader.


The color scale hugely amplifies minor differences, see my other comment. In the dataset, 15 years (2000-2014) are represented and the weekly cycle is therefore present. This could have been mitigated by using a 28-year dataset. Here is how often each month started on a given day in the dataset. We don’t have colored text so I used emoji.
Here is how likely any date is to be Monday-Friday in the data (out of 15):
You can see for example that August 01/08/15/22/29 is 10-20% more likely to be a workday than other days, which corresponds to the extra births. Feb 29 cannot be read directly from this table; its value is 3 out of 4 (2000: Tue, 2004: Sun, 2008: Fri, 2012: Wed).
As for your question: every month has approximately the same strength of the weekly cycle, it’s just that the prevailing colors in July-September show them the most. August’s is more visible because it does not have the disrupting July 4 and September 11.